Currencies
Tuesday, November 15, 2016
Rupee
RUPEE-
USD/INR
RUPEE
CMP-$67.77 (15.11.2016)
BEGINNING OF MISSING WAVE-(v) of V:
MEDIUM TO LONG TERM TREND REVERSAL:
RUPEE IS GOING TO DEPRECIATE AGAINST USD/INR IN MEDIUM TO LONG TERM:
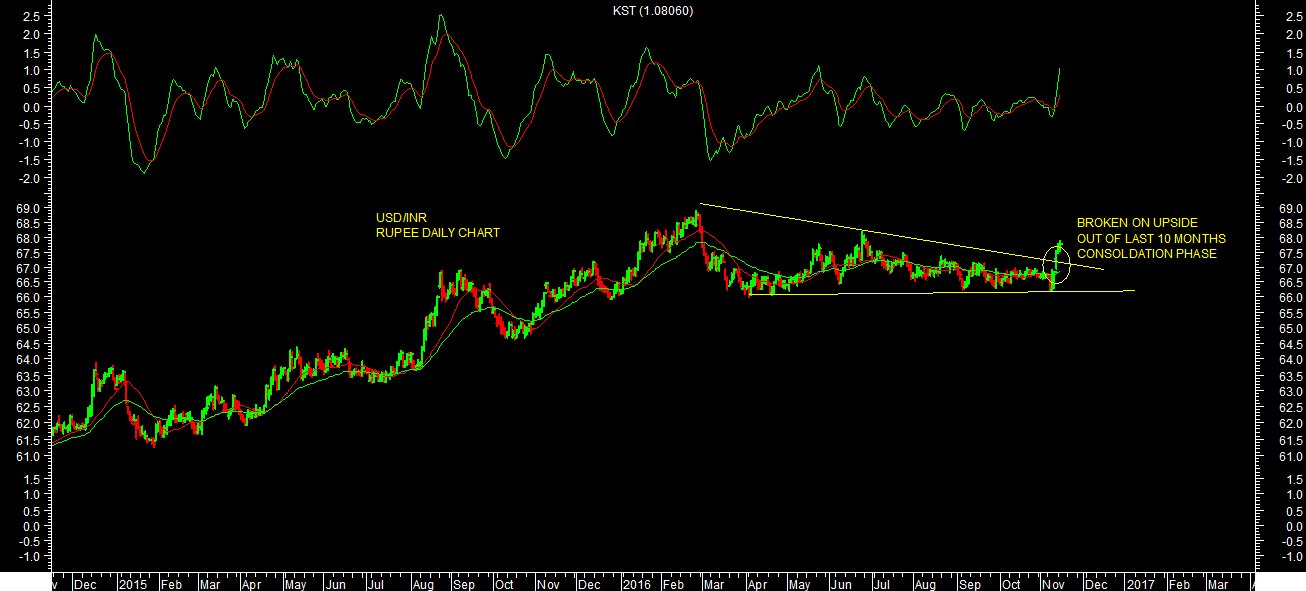
 Rupee closed @$67.77 as on 15.11.2016. It managed to find support around $66 levels. It made a low of $66.21 levels on 09.11.2016 and sharply bounced back from these levels. It has also broken out of consolidation phase of last 10 months on upside as per chart attached. One can expect Rupee to depreciate against USD in short to medium term till trend reverses.
I was having earlier view of end of 5 wave advance rally in recent high of around $68.89 levels as truncated wave-(v) of V near upper end of channel on 01.03.2016. We have seen slow & steady decline till $66 levels after that. But it consolidated well in last 10 months between $67.50-$66.50 levels. It has finally taken support at lower levels & given strong break out on upside as per chart attached which is sufficient enough for me to conclude medium to long trend reversal in USD/INR from wave count perspectives.
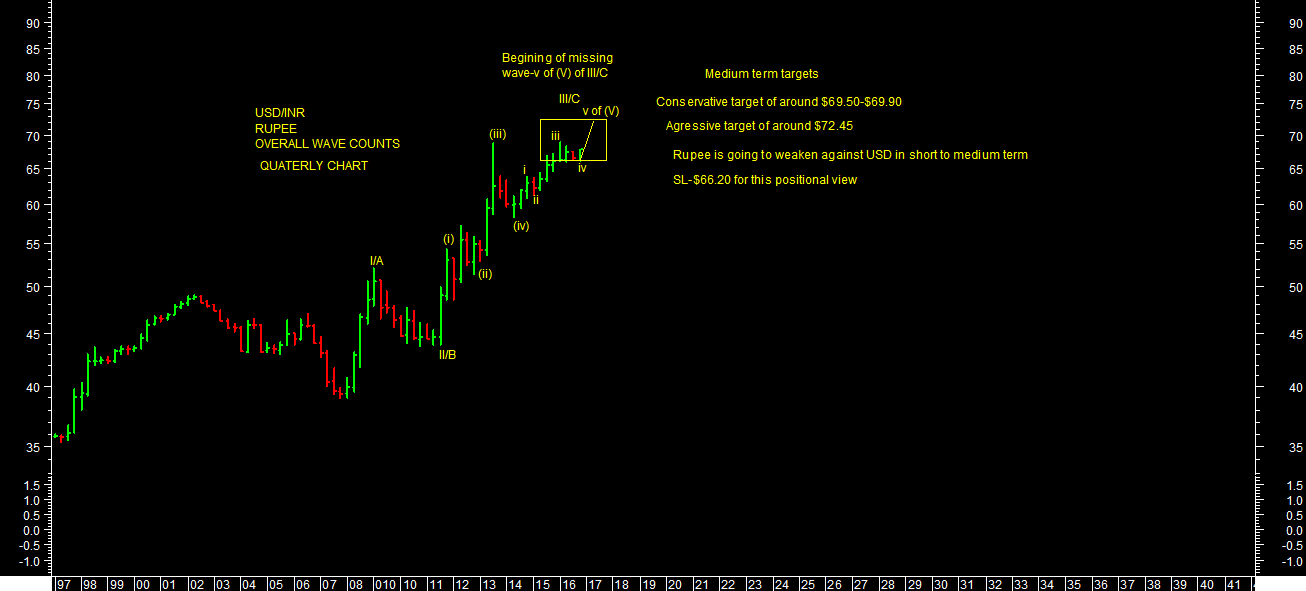
It looks like beginning of final & last wave-(v) of v of III/C as per quarterly wave counts chart attached. One can expect higher levels positional targets of around $69.90 to $70.50 levels conservatively & $ 72.50 levels aggressively in short to medium term till it holds support/stop loss of $66 levels. It has strong support around $66.85-$67 in near term.
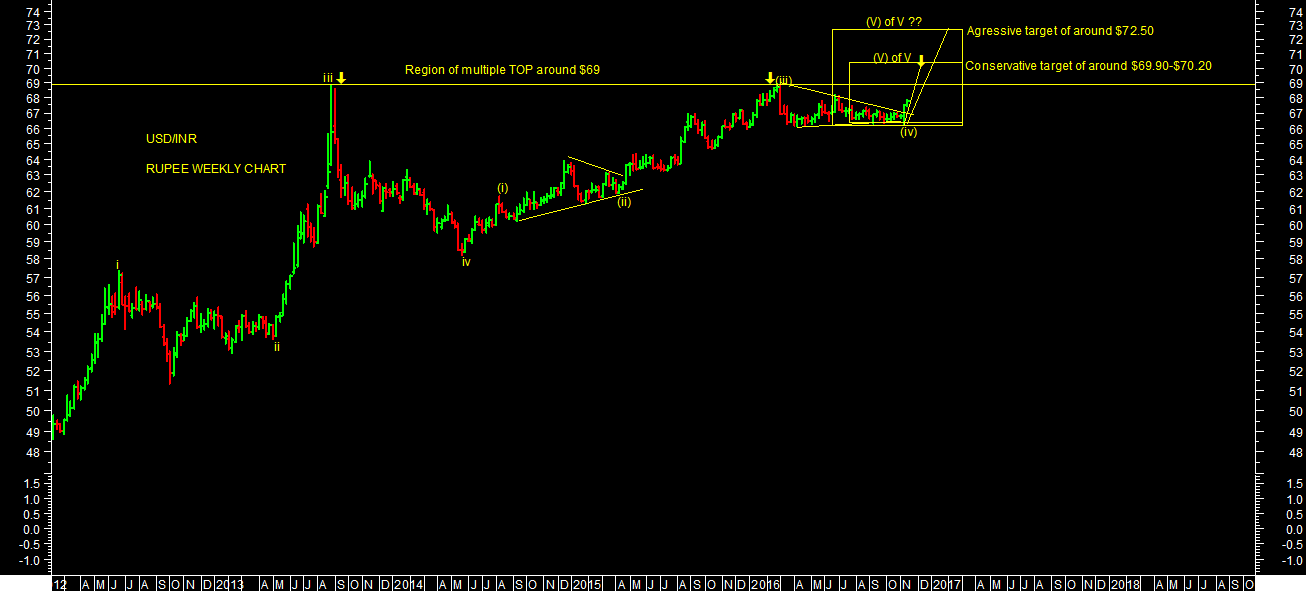
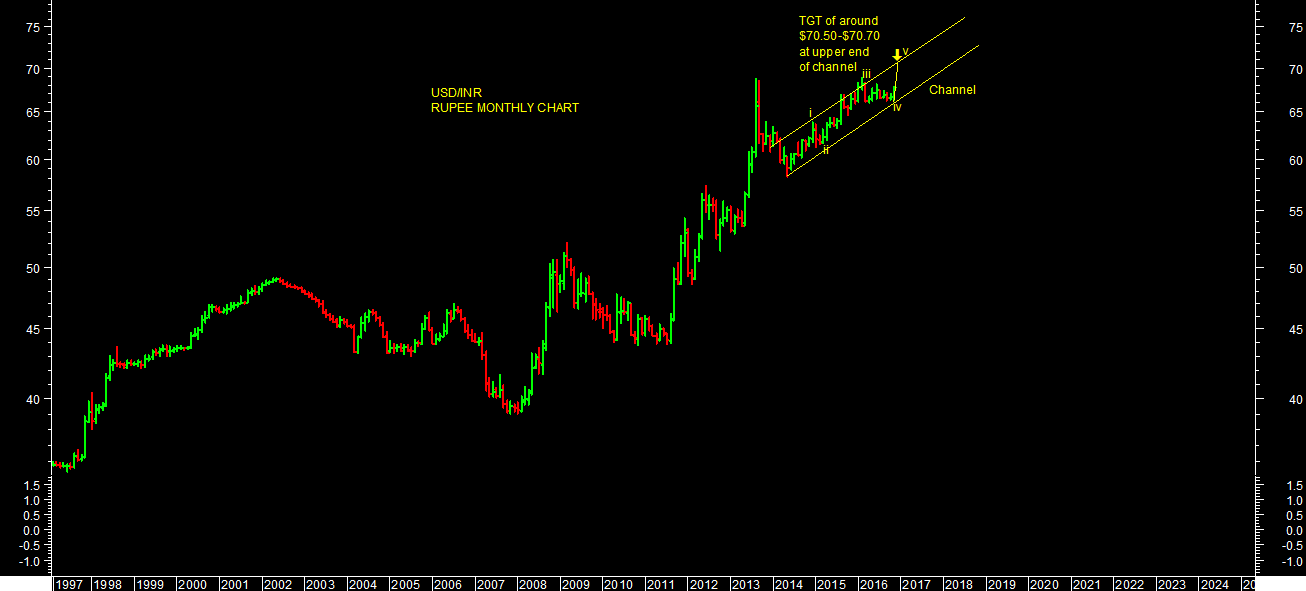
If we redraw channel on monthly chart then also it looks like beginning of wave-(v) of V up for the target of around $70.50 levels near upper end of channel as per chart attached. Daily & Weekly momentum indicators are in BUY mode. It managed to find support at 20MSMA, its strong sign supporting overall view till its proven otherwise.
Any kind of decline is a buying opportunity for Rupee for the conservative targets of around $69.90-$70.50 in short to medium term till trend reverses.
USD/INR
RUPEE
CMP-$67.77 (15.11.2016)
BEGINNING OF MISSING WAVE-(v) of V:
MEDIUM TO LONG TERM TREND REVERSAL:
RUPEE IS GOING TO DEPRECIATE AGAINST USD/INR IN MEDIUM TO LONG TERM:
I was having earlier view of end of 5 wave advance rally in recent high of around $68.89 levels as truncated wave-(v) of V near upper end of channel on 01.03.2016. We have seen slow & steady decline till $66 levels after that. But it consolidated well in last 10 months between $67.50-$66.50 levels. It has finally taken support at lower levels & given strong break out on upside as per chart attached which is sufficient enough for me to conclude medium to long trend reversal in USD/INR from wave count perspectives.
It looks like beginning of final & last wave-(v) of v of III/C as per quarterly wave counts chart attached. One can expect higher levels positional targets of around $69.90 to $70.50 levels conservatively & $ 72.50 levels aggressively in short to medium term till it holds support/stop loss of $66 levels. It has strong support around $66.85-$67 in near term.
If we redraw channel on monthly chart then also it looks like beginning of wave-(v) of V up for the target of around $70.50 levels near upper end of channel as per chart attached. Daily & Weekly momentum indicators are in BUY mode. It managed to find support at 20MSMA, its strong sign supporting overall view till its proven otherwise.
Any kind of decline is a buying opportunity for Rupee for the conservative targets of around $69.90-$70.50 in short to medium term till trend reverses.