Indices
Friday, June 03, 2022
INDICES:X- RAY REPORT OF MEDIUM TO LONG TERM WAVE COUNTS STRUCTURE & VIEW OF THE MARKET
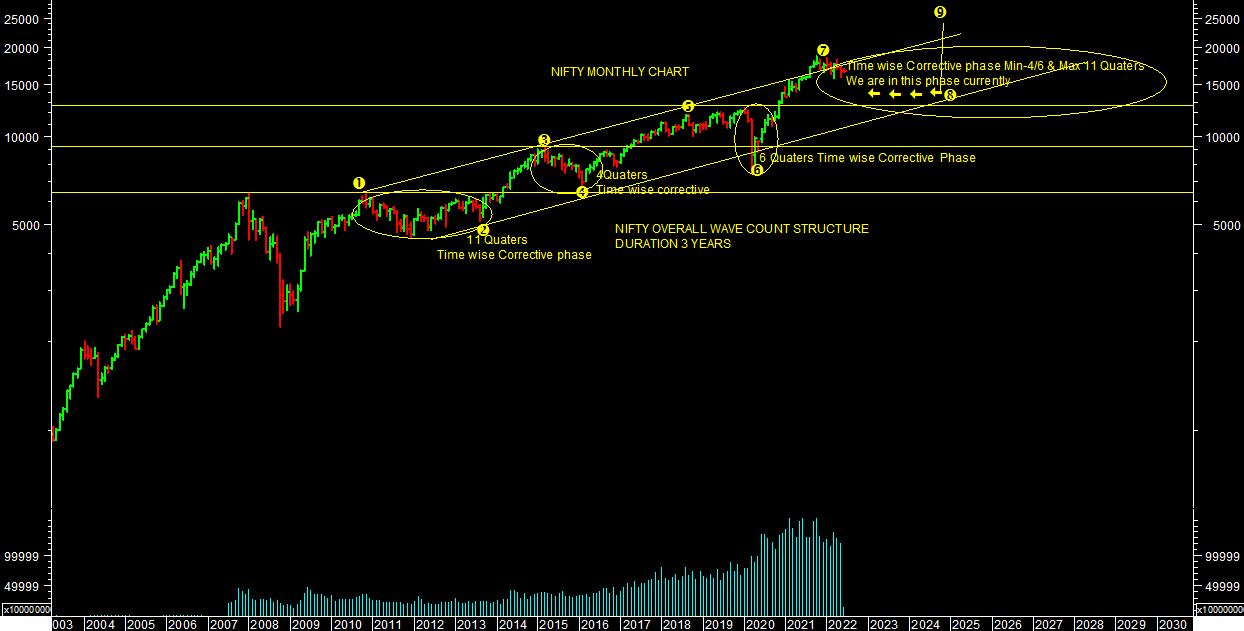
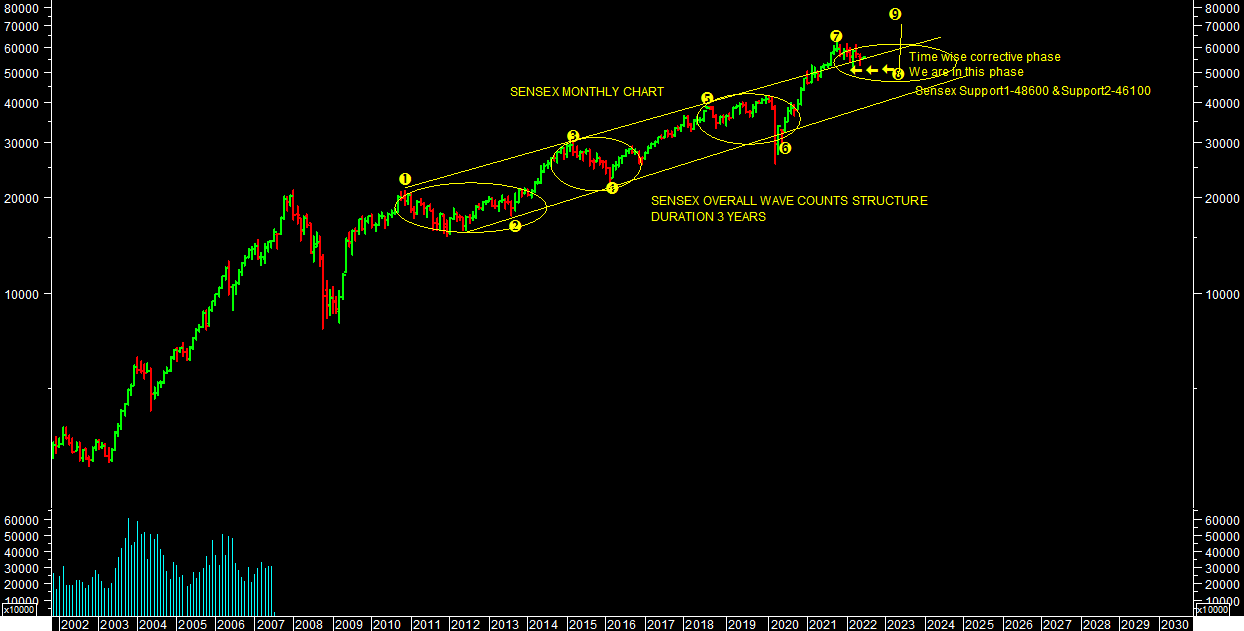
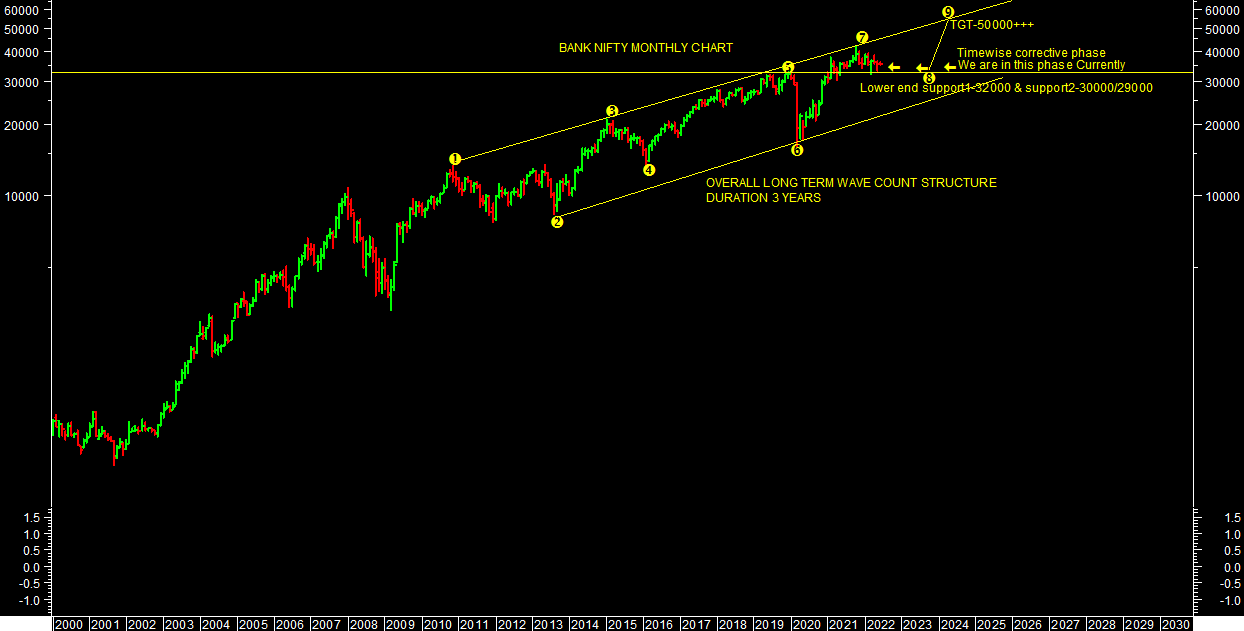
Nifty & sensex closed 16584.30 levels & 55769.23 levels on 03.06.2022. Sensex, nifty, Bank nifty & other Indices have completed 2 year rally after Covid crash of March 2020. We have seen upside rally till 18.01.2022 in the market. We have created TOP for this phase of rally. We are in Time wise corrective phase as per overall wave counts structure as per chart attached.
We will see this Time wise corrective phase till we cross 18351 levels on nifty & 61500 levels on sensex so far. We may trade in some broad range (15000-18000)for at least 4-6 Quarters before bottoming out.Downside will not be significant price wise but it looks like time wise correction this time.
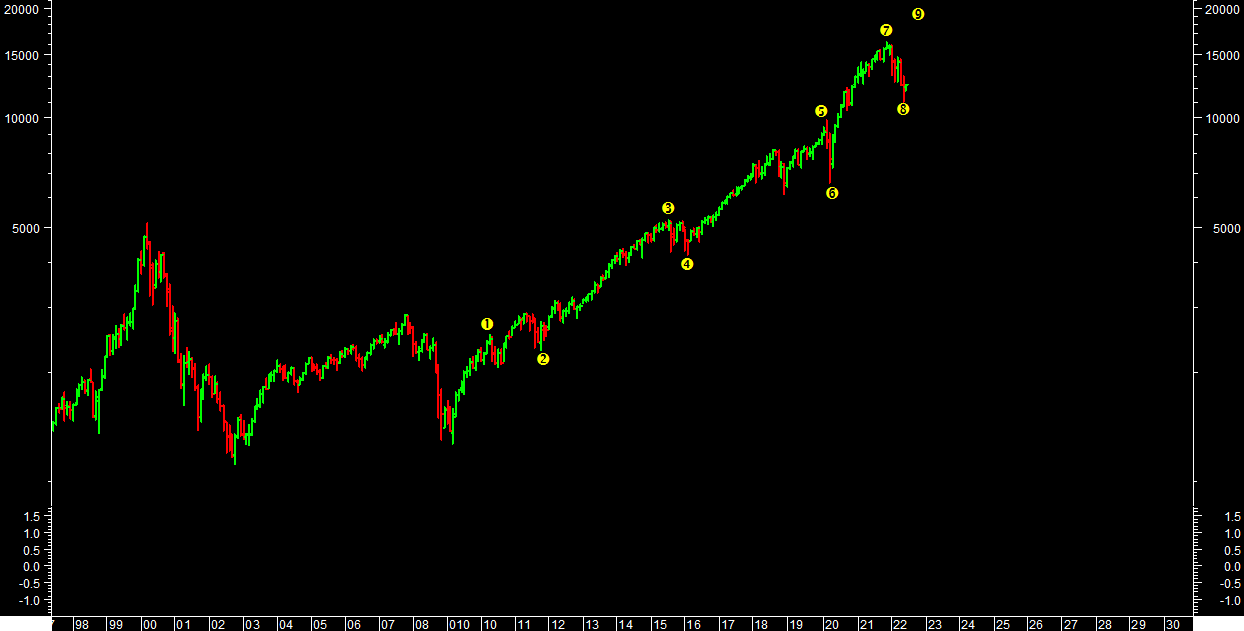
I have a similar wave count structure & view particularly for USA Market all Indices such as (S&P500,Dow jones & Nasdaq composite).I have attached here Nasdaq Composite Long term Charts with wave Counts.
Nifty has support1-14400 & Support2-13600 (In worse case) while sensex has support1-48600 & Support2-46100 (In worse Case). Investor should buy stock specific & Quality companies in this phase of correction for next phase of Bull Market as per chart attached. I am expecting conservatively Targets in sensex around 80000/85000++, Nifty around 23000/24000+++ & Bank nifty around 50000++ from medium to long term perspectives after end of this phase of correction.
Momentum Trading will be challenge in this Time wise phase of market due to high volatility in the market. One should trade full range from positional Perspectives or else trade Range on both sides with slightly wider stop losses.
Conclusively, there is still one more phase of Bull market remaining as per overall wave counts structure of the chart attached. One should focus more on buy side with patience in this phase of market. I am confident that Investor will earn decent return with horizon of 1-3 years from here on.