World Market Watch
Study Charts

Disclaimer
The views expressed are based purely on Technical studies. The calls made herein are for information purpose only. The information and views presented here are prepared by Devang Shah.The information contained herein is based on my analysis of the Charts. I, however, do not vouch for the accuracy or the completeness thereof. This material is for personal information and I am not responsible for any loss incurred based upon it. The Investment discussed & recommended on this website may not be suitable for all. Investors must make their own investment decisions based on their specific investment objectives and financial position and using such independent Views, as they believe necessary.
While acting upon any information or analysis mentioned on this website, investors may please note that neither Devang Shah nor any person connected with him accepts any liability arising from the use of this information and views mentioned herein. I may hold long or short positions in the securities/commodities discussed herein from time to time. Neither the information nor any opinion expressed herein constitutes an offer or an invitation to make an offer, to buy or sell any securities/commodities, or any options, futures or other derivatives related to such securities/commodities.

Indices


Wednesday, February 03, 2016

INDICES:

INDICES:

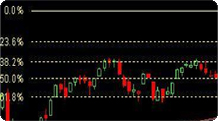
NIFTY COMPARISION OF 2010-2011 TIME WISE CORRECTIVE MAKRET WITH CURRENT 2015-16 TIME WISE CORRECITVE MAKRET:

HOW TO IDENTIFY MEDIUM TERM BOTTOM???? (SOME TIMES SIMPLE ANALYSIS WORKS BETTER THEN COMPLEX ANALYSIS)


Click

Click
We do a lot of analysis in market to identify medium term TOP & BOTTOM on main indices i.e. - Nifty & Sensex. What I have seen esp. such kind of complex corrective time wise bear market, simple analysis works better then complex analysis to identify medium term bottom or top & i.e. Simple “DOW THEROY ANALYSIS” But we may sometimes forget such simple analysis while busy in complex Analysis.

I have made a comparison of 2010/11 Complex corrective market with current one of 2015-16 as per chart attached. In such cases if market violates LOWER TOP then, only we get first confirmation of medium term reversal.

Therefore, in present scenario as well, I kept my medium term reversal as 7973 levels on nifty & 26,198 levels on sensex which are previous TOP, If we are not able to surpass it, then, we will not get confirmation of medium term reversal & eventually prepare for further lower levels targets in medium term as per market outlook & also as per chart attached.

Therefore conclusively in current scenario, whether 7240 levels on nifty & 23,839 levels on sensex are medium term bottom or not?, is not conclusive till we surpass previous lower tops of 7972 levels on nifty & 26,198 levels on sensex as per chart attached form medium term perspectives.


Next Page         Previous Page
Back to TOP
Copyright © 2010.http://www.TrendTechno.com ALL RIGHTS RESERVED.