Indices
Tuesday, February 15, 2016
INDICES:INDICES:
IS IT 2008 or 2000-2001 case of Collapse??
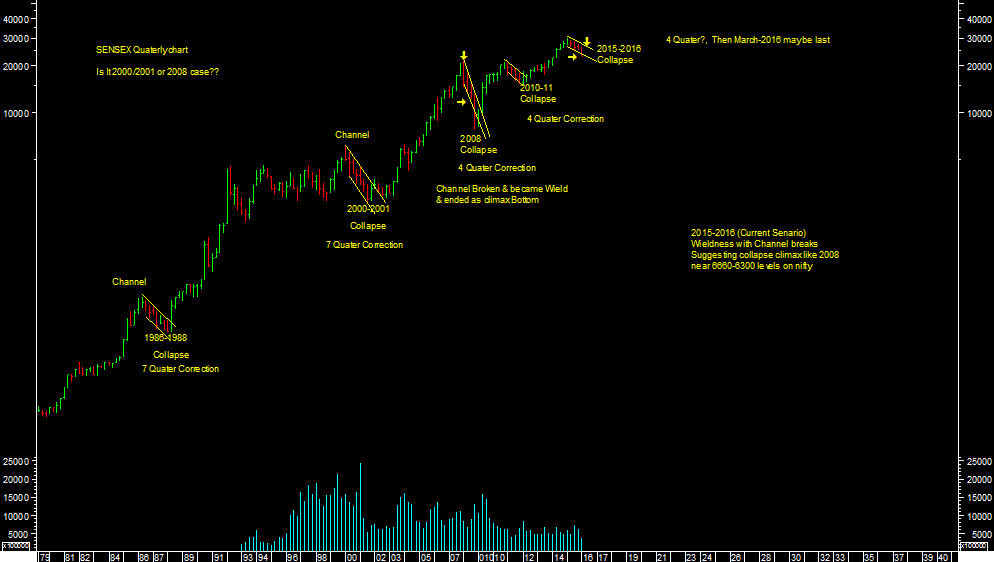
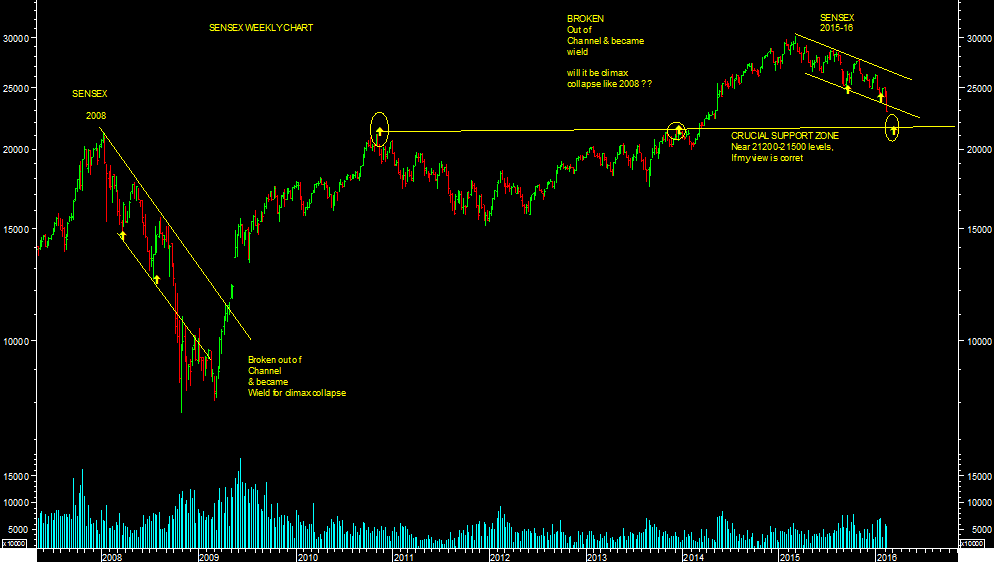
I tried & studied various Bear market like -1986/88, 2000/01, 2008, 2010/11 & finally current 2015/16. I found that In this all major bear market corrective phase, market corrected time wise within channel but only two occasion i.e.2008 & current one 2015/16 in which sensex/Nifty has broken out of channelised correction on down side Therefore, so far it looks like 2008 corrective collapse kind of phase. If its similar then, expects market correct sharply till 22200-21200 levels in short to medium term as market out look view not beyond that if this analysis is correct.
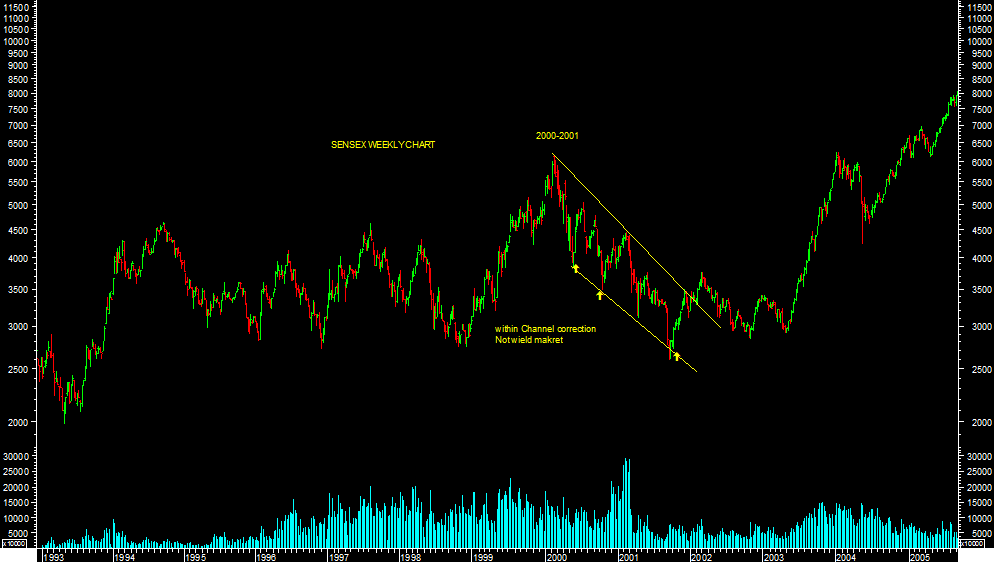
I have also attached weekly charts of sensex 2000-2001 case & also 2008 & 2015/16 current cases. One can see channelised corrective phase of 2000-01 case & channel break down case of 2008 market. Therefore, conclusively, it looks like possible case like 2008. In that case we can go till further lower levels till 22200-21200 levels as per chart attached.
Secondly, In India, we have seen normally 4 quarter correction except in 1986-88 & 2000-01 which lasted till 7 quarter. And so far we are in 4th quarter of this correction which is going to end in March 2016. So if its bottoming phase near lower levels then, one should watch out beginning of positive quarter from June 2016 after major medium term end of correction at lower levels.
Apart from these analyses, as mentioned earlier i.e. - simple Dow Theory also works to conclude end of medium term correction. Therefore, in current case 7600 levels on nifty & 25000 levels on sensex are important resistance/reversal levels at current levels of market from medium term perspectives.
My analysis is based of historical Bear market particularly based on Channel Analysis & also Quarterly Analysis.